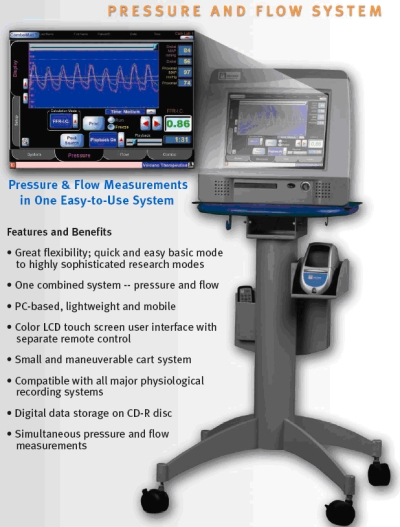
1. Complete Combowire System -Simultaneous Pressure and Flow Measurement
The system is
very portable and user-friendly with convenient touch-screen navigation
for
easy operative toggling and pre-operative calibration. The 15” LCD
monitor
displays charts and values in real-time and is able to calculate
physiological
parameters instantaneously.
2. ComboWire Guide Wire Design – Specifications
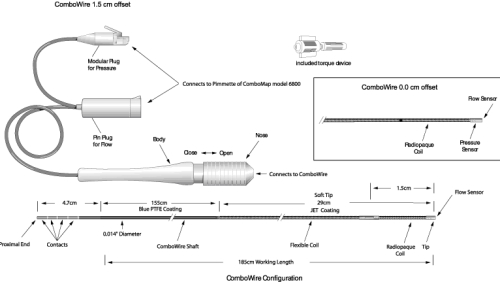
While
ComboWire
guide wire had an earlier version with the pressure sensor positioned
1.5 cm
from the tip flow sensor, the newer version, shown in the box above,
has both
sensors located at the tip. This was motivated by the clinical need to
obtain
dual modality data from the same location as well as a reduction in
procedural
complexity and error. This is the first guide wire that obtains
intravascular
flow and pressure information simultaneously which enable the
calculation of a
new hemodynamic index (HSR) discussed below.
3. Discordance in Current Hemodynamic Parameters – FFR and CFR
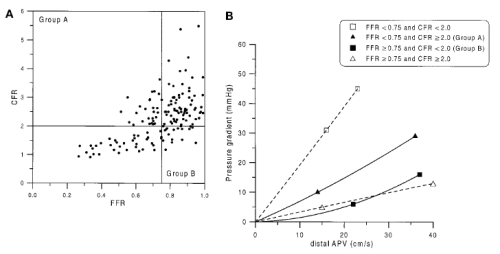
While both
FFR
and CFR are highly utilized to ascertain the physiological effect of a
stenotic
lesion, the best cutoff value of 0.75 and 2.0 for FFR and CFR
respectively,
does not always correspond in intermediate lesions (40% to 70% diameter
stenosis). Figure A
shows a scatter plot
of data from 150 patients with intermediate lesions. While upper right
and
lower left quadrants correspond in terms of diagnostic significance of
the
lesion, the other two quadrants are discordant values. Similarly, the
graph B
illustrates the uncertain nature of the 4 possible diagnostic outcomes
as well
as the variability in the pressure drop at increased flow rates
(hyperemia)
compared to resting flow.
4. Patients with Discordant Assessment – Table
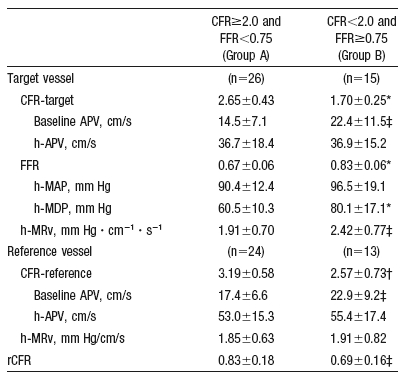
Out of 150
patients with intermediate stenosis, 41 had discordant values leading
to
uncertainties in treatment options.
5. New Index – HSR Motivation
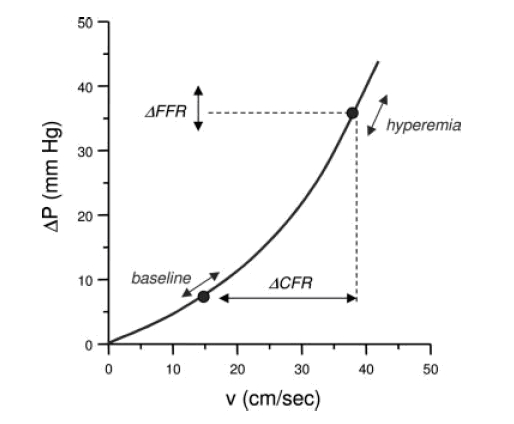
The
curvilinear
relationship between pressure drop across the stenotic region and flow
velocity
illustrates the possible confounding effects of measuring FFR and CFR
alone.
Ratios of pressure measurements (FFR) and flow reserves (CFR) are
subject not
only to initial resting conditions (baseline), but also to the ability
to
pharmacologically induce maximum flow in the patient. A new index
called HSR (=
∆P/v) was proposed to offset this dependence on flow variation within
patient
groups. The HSR index is less sensitive to variation flow conditions
since an
increase in the denominator (v) corresponds to an increase in the
numerator
(∆P) thereby minimizing variability.
6. HSR Validation
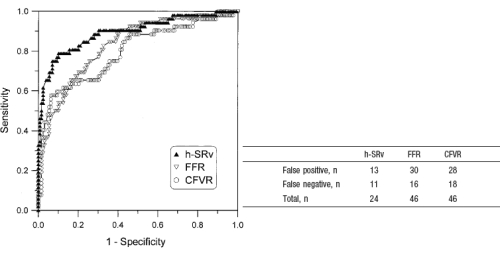
A panel of
nuclear medicine physicians conducted an SPECT emission scan and
evaluated the
group of 151 patients post FFR, CFR, and HSR measurements. The table on
the
right shows the number of patients in each of the misclassified
categories with
HSR having almost half the number of FFR and CFR alone. An ROC curve on
the
left, further shows a higher area under curve (AUC) for HSR with values
of
0.90, 0.82, and 0.80 for HSR, FFR, and CFR respectively.
