1. Coronary Vasculature
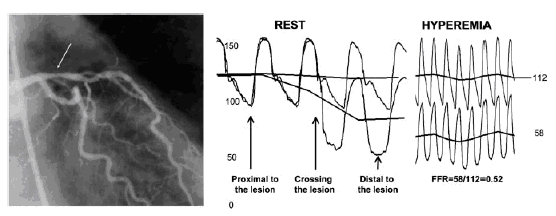
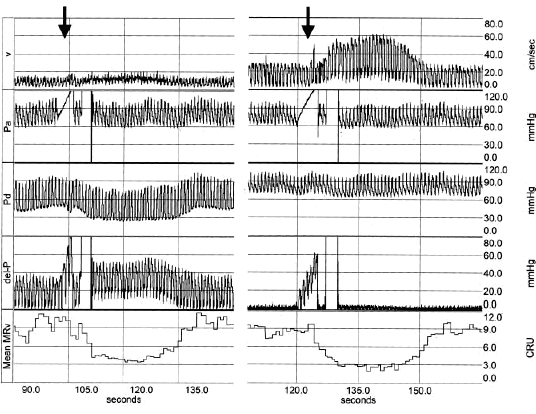
Sample data
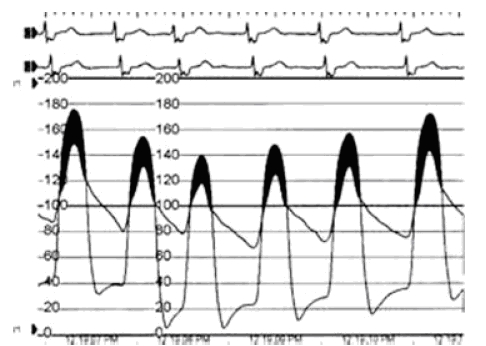
generated by advancing a guide wire past a lesion site and
simultaneously
recording cyclical pressure proximal and distal to the site. Proximal
pressure is
often well correlated with aortic pressure and can be measured at the
tip of
the catheter in the aortic arch prior to entrance into the ostia. The
graph
below is from a ComboWire recording showing the advantage of having a
velocity
recording as well as the parallel calculation of ∆P by the system.
Induction of
hyperemia coincides with the increase in velocity and a drop in distal
pressure
(arrows).
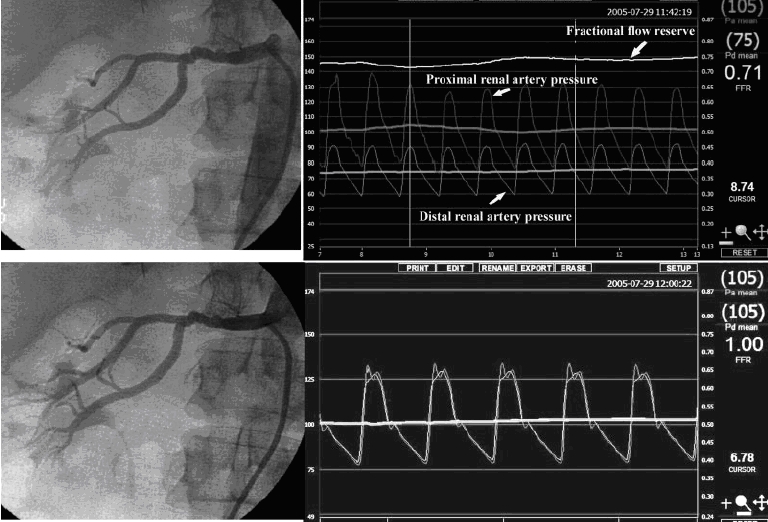
2. Renal Vasculature
3. Abdominal Vasculature
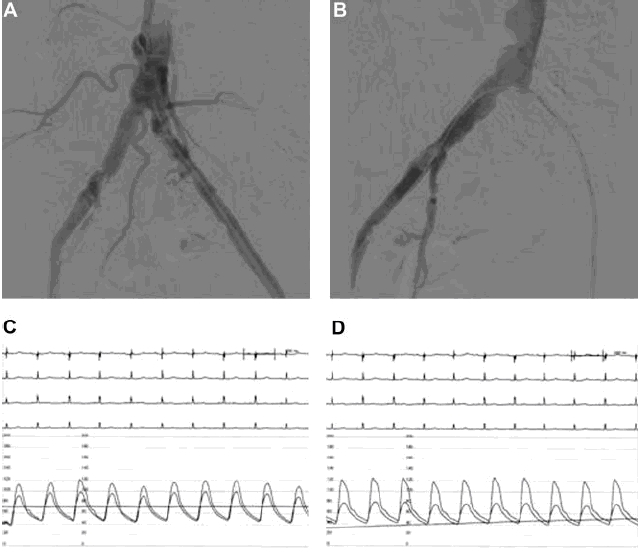
Abdominal angiogram of the right iliac artery reveals eccentric stenosis of unknown severity. Pressure wire tracings, however, reveal a 10 mmHg gradient at rest and 20 mmHg during hyperemic runs. This gives another good example of the necessity of hemodynamic data as well as potential future consideration for HSR calculation via ComboWire.
The
extremely
small diameter of current guide wires (0.36 mm) allows their use in a
wide
range of clinical applications including assessment of heart valves
like the
mechanical aortic heart valve shown here. The gradient was calculated
by
subtracting the ventricular pressure, measured by pressure wire inside
the left
ventricle, minus the aortic pressure, measured by fluid-filled catheter
in the
aorta. The echocardiography measurement of 48 mmHg was shown to be
inaccurate
by direct pressure wire measurement of 24 mmHg gradient.
