1. Atherosclerosis Pathology
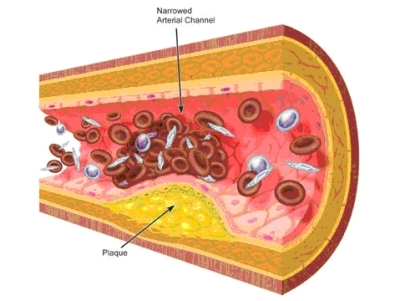
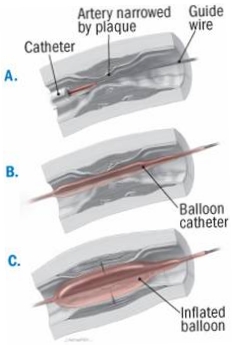
Atherosclerosis affects an overwhelmingly large percentage of the world population despite varying degrees of severity and progression. The formation of fatty plaques, as depicted bellow, is the hallmark of the disease and, in advanced stages of atherogenesis, results in thickening of the arterial wall and the subsequent protrusion into the artery lumen. While generally asymptomatic in early stages, the symptoms of atherosclerosis usually present as a consequence of artery stenosis, or narrowing, secondary to plaque protrusions into the lumen space.
2. Stenosis Modeling
Stenotic
lesions
are the central focus in vascular intervention and are characterized by
their
effect on blood flow which supplies the oxygen demand of the underlying
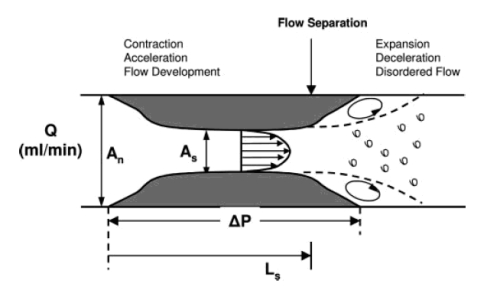
tissues. The schematic bellow depicts a lesion of length Ls
and area
As that affects an artery with normal diameter
represented by An.
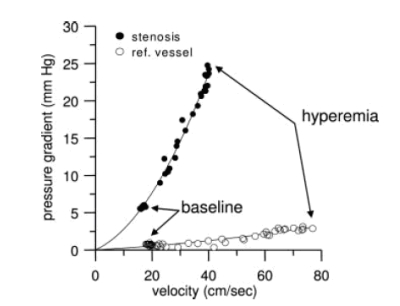
Pressure Drop (∆P): This results from frictional losses in the entrance and along the length of the stenosis, which are linearly dependent on flow rate, and inertial losses due to the sudden expansion which increase with the square of flow rate, as discussed later.
Increase in Resistance (R): The increase in vessel resistance is an obvious result of interluminal occlusion at the lesion site that is characterized as a percent reduction in internal diameter. It’s important to know that resistance has a 4th order dependence on internal diameter.
Reduction
in Maximal Flow
(Qmax):
The
simultaneous drop in pressure and increase in resistance limit the
maximal flow
across a stenotic lesion since flow rate is directly related to
pressure and
inversely related to resistance.
3. Stenosis Physiology
4. Angioplasty Treatement
5. Angioplasty Evaluation
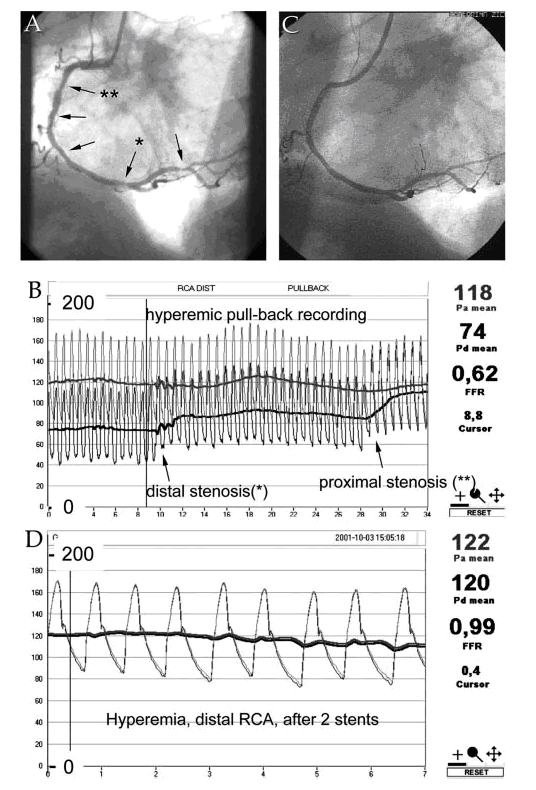
The figure bellow demonstrates the typical pressure data (B and D) and anatomic data (angiograms A and C) gathered in the catherization laboratory of the hospital. One can see the drop in pressure as a pressure wire is advanced past the lesion site as evidenced by the separation between the bold lines in figure B that represent the means of pressure cycles in the aorta and wire tip. FFR or Fractional Flow Reserve is the ratio of proximal to distal pressure of the stenosis and is displayed in both pressure tracings. This is an important parameter in both lesion diagnosis and treatment evaluation after angioplasty or revascularization procedure.
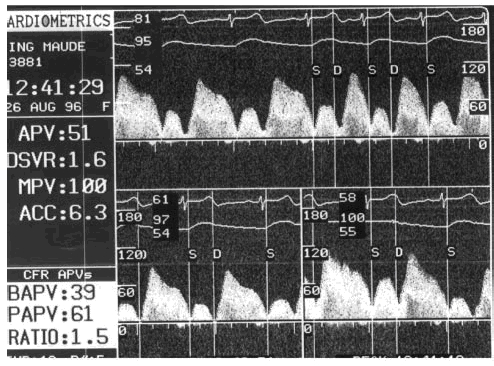
The figure
bellow
is a Doppler flow velocity tracing in the stenotic artery showing the
ratio of
hyperemic (maximal) to basal (resting) flow called Coronary Flow
Reserve or
CFR. This number is displayed in the lower left corner denoted by
RATIO. The
above Doppler data complements the FFR data discussed previously.