|
The BIS
Index is a processed EEG parameter with extensive validation and
demonstrated clinical utility. It is derived utilizing a composite of
measures from EEG signal processing techniques including bispectral
analysis, power spectral analysis, and time domain analysis. These measures
were combined via an algorithm to optimize the correlation between the EEG
and the clinical effects of anesthesia, and quantified using the BIS Index
range.
At the core of brain monitoring technology is the surface
electroencephalogram (EEG). This complex physiologic signal is a waveform
that represents the sum of all brain activity produced by the cerebral
cortex. The normal waveform is notable for two characteristics:
Small amplitude (20-200 microvolts)
Variable frequency (0-50 Hz)
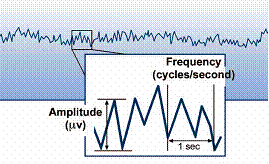
Figure 1: Complex EEG waveform Waveform
is typically analyzed using measuresof waveform amplitude (microvolts)
andfrequency (cycles/second Hz).
It has
been known for decades that the EEG changes in response to the effects of
anesthetic and sedative/hypnotic agents. Although individual drugs can
induce some unique effects on the EEG, the overall pattern of changes is
quite similar for many of these agents. As seen in Figure 2, during general
anesthesia, typical EEG changes include:
An increase in average amplitude (power)
A decrease in average frequency
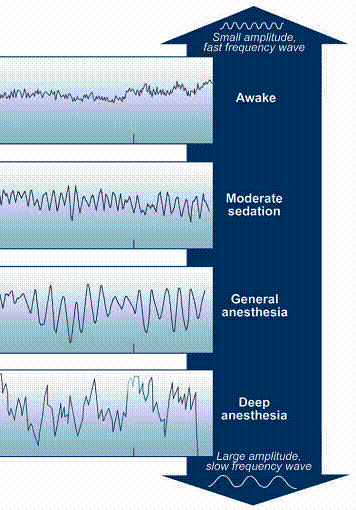
Figure 2: General pattern of EEG changes observed during
increasing doses of anesthesia As
anesthetic effect increases, EEG frequency typically slows resulting
in transition through frequency-based classes: Beta
-> Alpha -> Theta -> Delta.
The
complex EEG waveform can be broken down into its individual components.
This data can then be analyzed using a technique called power spectral
analysis and displayed as power per frequency component in a power
spectrum (Figure 3). Power spectral analysis can result in one or more
numeric descriptors known as processed EEG parameters. Processed EEG
parameters that have been investigated as indicators of anesthetic effects
include:
95% spectral edge frequency
Median frequency
Relative delta power
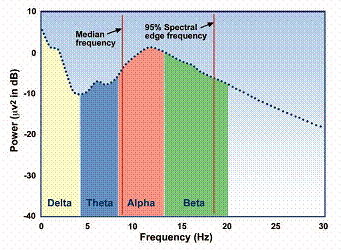
Figure 3: Power spectrum display and analysis of a typical
EEG segment Classic frequency bands are defined by
frequency limits, and shaded
in different colors for illustration. Power spectral analysis
calculates the Median Frequency and 95% Spectral Edge
Frequency values based upon the distribution of power. Relative
Delta Power would calculate the power contained in the
delta band (yellow) compared to the entire spectrum.
These
parameters are various characteristics that describe the EEG power
spectrum. Median frequency and 95% spectral edge frequency (Figure 3)
indicate the spectral frequency below which contains either 50% or 95% of
the power in the EEG. Relative delta power describes the percentage of EEG
power in the delta band range (0.5-3.5 Hz) relative to the power over the
entire EEG frequency spectrum. Unfortunately, for most anesthetic drugs,
the relationship between dosage and changes in EEG power and frequency is
not straightforward, so it has been difficult to use traditional processed
EEG parameters in a clinically reliable way.
The BIS Index is a numerical processed, clinically-validated EEG parameter.
Unlike traditional processed EEG parameters derived from power spectral
analysis, the BIS Index is derived utilizing a composite of multiple
advanced EEG signal processing techniques including bispectral analysis,
power spectral analysis, and time domain analysis. These components were
combined to optimize the correlation between the EEG and the clinical
effects of anesthesia.
There are three key elements integral to the BIS technology in monitoring
brain status during anesthesia:
Bispectral Analysis
BIS Algorithm
BIS Index
Bispectral Analysis
A portion of the cortical EEG reflects changes attributable to harmonic and
phase relationships between cortical and subcortical neural generators.
These relationships are altered during hypnosis, producing characteristic
patterns in the EEG.
Bispectral analysis and its results, e.g., bicoherence, bispectrum, real
triple product is a sophisticated signal processing methodology that
assesses relationships among signal components and captures synchronization
within signals like the EEG. By quantifying the correlation between all the
frequencies within the signal, bispectral analysis (together with power
spectral and cortical EEG analysis) yields an additional EEG descriptor of
brain activity during hypnosis.
Multivariate statistical models were used to derive the optimum
combination of these EEG features to correlate with clinical endpoints of
sedation. From this iterative process, the BIS algorithm that would yield a
clinically-tuned, valid processed EEG parameter was developed.
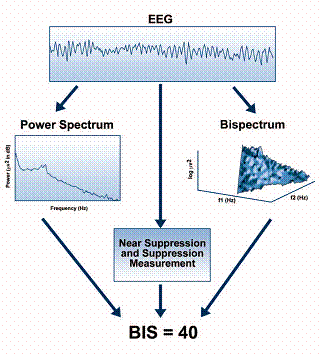
Figure 5: Schematic diagram of signal processing paths
integral to generating a single BIS Index value Original
EEG epochs (following digitization and artifact processing) undergo three
primary paths of analysis Power Spectral Analysis, Bispectral Analysis,
and Time-Based Analysis for Suppression/Near-Suppression to look for key
EEG features.The BIS Algorithm, based upon statistical modeling, combines
the contribution of each of the identified features to generate the scaled
BIS Index.
The BIS Index is a number between 0 and 100 scaled to
correlate with important clinical endpoints during administration of
anesthetic agent (Figure 6). BIS values near 100 represent an awake clinical
state while 0 denotes the maximal EEG effect possible (i.e., an isoelectric
EEG). As the BIS Index value decreases below 70, the probability of
explicit recall decreases dramatically. At a BIS Index value of less than
60, a patient has an extremely low probability of consciousness. BIS Index
values lower than 40 signify a greater effect of the anesthetic on the EEG.
At low BIS values, the degree of EEG suppression is the primary determinant
of the BIS value. Prospective clinical trials have demonstrated that
maintaining BIS Index values in the range of 40-60 ensures adequate
hypnotic effect during general anesthesia while improving the recovery
process. During sedation care, BIS Index values > 70 may be observed
during adequate levels of sedation but may have a greater probability of
consciousness and potential for recall. The BIS Index provides a direct
measurement of brain status, not the concentration of a particular drug.
For example, BIS Index values decrease during natural sleep as well as during
administration of an anesthetic agent. The decrease produced during the
natural process of sleep, however, is not to the degree caused by high
doses of propofol, thiopental or volatile anesthetics. The BIS Index values
reflect the reduced cerebral metabolic rate produced by most hypnotics.
Using positron emission tomography, a significant correlation between BIS
Index values and reduction in whole brain metabolic activity was measured
(Figure 7).
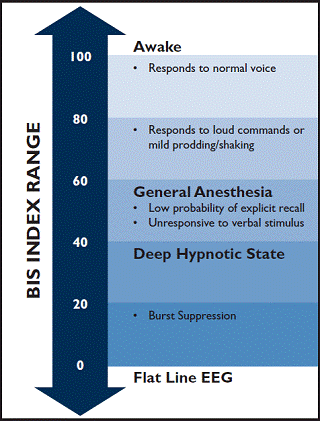
Figure 6: BIS Index range guidelines The
BIS Index is a scale from 100 (Awake, responsive
to normal voice) to 0 (Representing an isoelectric,
flat line EEG).The illustration includes important
clinical or EEG milestones that are observed
between these two ends of the scale range.
 Figure
7: Correlation of BIS with brain metabolic activity Significant
correlation is seen between decreasing brain metabolic rate (%BMR = percent
of initial whole-brain glucose
metabolism measured from PET scan) and increasing anesthetic effect (as
measured by decreasing BIS value). Figure
7: Correlation of BIS with brain metabolic activity Significant
correlation is seen between decreasing brain metabolic rate (%BMR = percent
of initial whole-brain glucose
metabolism measured from PET scan) and increasing anesthetic effect (as
measured by decreasing BIS value).
|