The DNA Microarray:

        Approaching Personalized Medicine

Home
The Microarray
Leukemia Research
Links
References


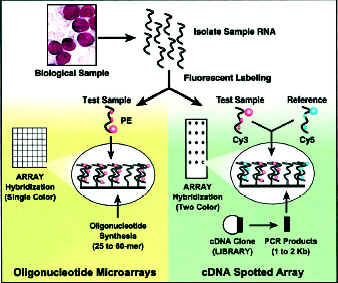
What is a DNA-microarray?    Fabrication    Gene Expression Profiling


  Ramaswamy et al. 2001

Below outlines the use of a cDNA-microarray for gene expression profiling.

  1. Sample RNA, which represents the gene expression profile of the sample, is converted to cDNA or cRNA and fluorescently tagged.  For this process, two samples are taken and tagged with unique markers.  One sample will be from the diseased cells, the other will be from healthy cells.  The tagged cDNA is the "target" of the "probes" on the microarray.
  2. The target sample is allowed to hybridize to the probes and any unhybridized sample is washed away.
  3. Using a scanning laser and a confocal microscope or CCD device, the intensities of the two fluorophores is measured.
  4. The relative intensities of the two fluorophores represents the relative gene expression of the diseased cells compared to the healthy cells.  Genes will either be over expressed, under expressed or expressed the same as in healthy cells.
  5. The data is further analyzed to determine an expression profile that can separate the diseased cells into subpopulations.  This analysis is discussed below.

Oligonucleotides microarrays follow a similar process, however no control sample is used.  Instead of a relative value, a well defined, arbitrary value is produced.


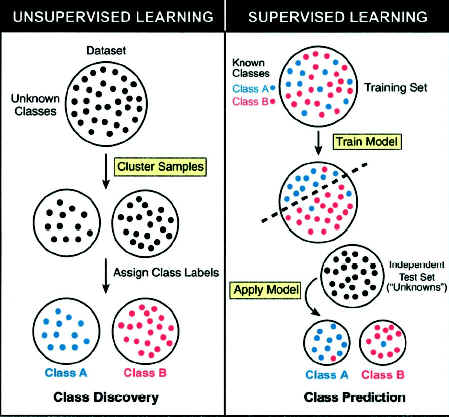
There are two basic approaches to analyzing gene expression data.  

Supervised - For supervised data analysis, genes are fit into a predetermined pattern usually based on correlating gene expression to clinical data.  Measurements are separated into two groups for analysis.  The first group is the 'learning group' or 'training group' at which time the patterns are recognized.  The second group is then used to confirm the pattern by predicting the subpopulation grouping based on the previously learned pattern.

Unsupervised - For this type of analysis, there is no 'learning group.'  Samples are grouped based solely on the similarity of their gene expression profile.  With this technique, new subgroups are often discovered. 


 Ramaswamy et al. 2001


This site was created for informational purposes and is part of the
BME240 - Intro to Clinical Medicine class project.

Please visit our other sites at:
http://bme240.eng.uci.edu/index.html

Site creator: Fred Ayers