How are microbubbles and acousti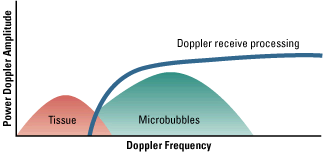 c signals related?
The rationale for using microbubbles as ultrasound contrast agents is based primarily on their compressibility.
Because they are gas-filled and smaller than the wavelength of diagnostic ultrasound, microbubbles undergo
oscillation in an acoustic field, such that they compress and expand at the pressure peaks and troughs,
respectively. Radial oscillation of microbubbles results in the generation of strong acoustic signals that can
greatly exceed conventional ultrasound backscatter produced by reflection or alteration in acoustic
impedance. The microbubble signal is dependent on the compressibility and density of the gas, the viscosity and density of the surrounding medium, the
frequency and power of ultrasound applied, and the bubble size. Many of the microbubble agents used in contrast ultrasound are encapsulated, so viscous
and elastic damping effects of a shell also need to be considered. At high acoustic powers, microbubbles can be destroyed by ultrasound imaging by either
outward diffusion of the gas during the compression phase, diffusion from large shell defects, or from complete fragmentation of microbubbles.
Microbubble destruction during high-power ultrasound exposure is an important feature for both perfusion imaging protocols and for therapeutic
applications. For the latter, changes in the micro-environment or even shell ballistic events are probably required for local delivery of drug or gene
payload.
Where is contrast enhanced ultrasound used currently?
- Non-vasular uses
- Sonosalpinography
- Detection of vesico-ureteric reflux
- Cancer Diagnosis
In this technique, the fallopian tube patency is tested by instilling a contrast agent into the uterne cavity and noting it's passage along the tube.
For this application, a contrast agent is injected into the bladder and the renal pelves and ureters are studied.
- Liver cirrhosis
- Pancreatic cancer
- Colon carcinoma
- Prostate carcinoma
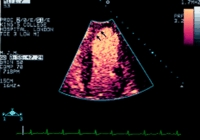
- Echocardiography
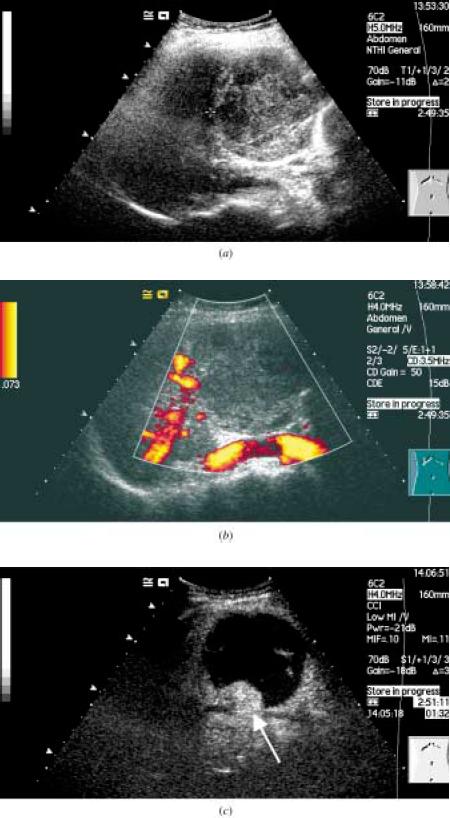
The figure above shows the follow-up ultrasound in a 46-yr old lady who had undergone chemoembolization of a hepatocellular carcinoma(HCC).
(a) The baseline ultrasound shows an HCC with an area of necrosis.
(b) Power doppler interrogation shows no evidence of tumor recurrence.
(c) Following a bolus injection of the microbubble Sonovue, the vascular phase was imaged using contrast coherent imaging mode and shows an
avidly enhancing peripheral lesion (arrow) which was confirmed to be a recurrent HCC.
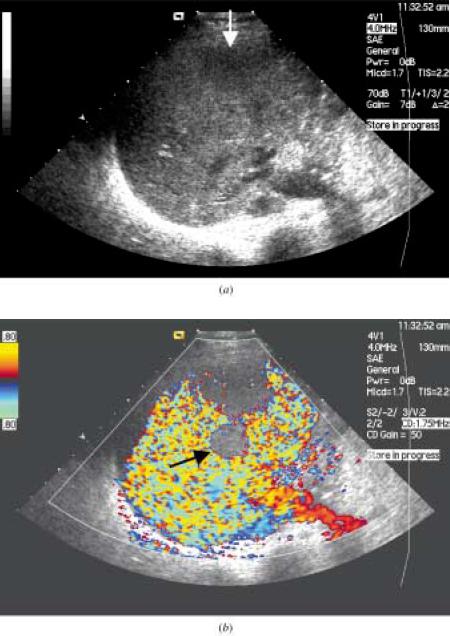
The figure above shows section through the right lobe of liver in a 76-yr old man with pancreatic carcinoma.
(a) The baseline B-mode image shows a subtle metastasis (arrow).
(b) Imaging in stimulated acoustic emission (SAE) mode 3 minutes after Levovist not only improves the conspicuity of the metastasis but also
reveals a further metastasis (arrow) which cannot be seen in B-mode.
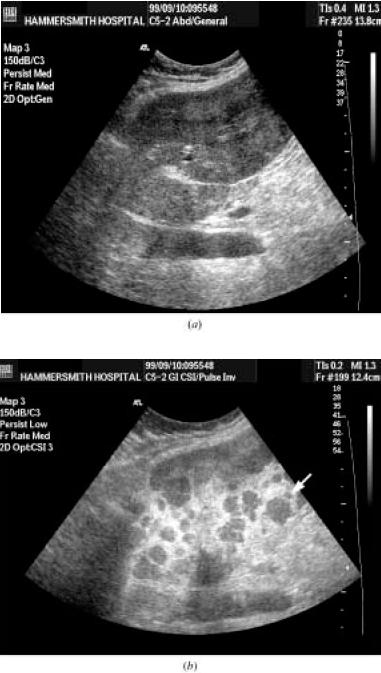
The figure above shows the longitudinal section of the left lobe of liver of a 74-yr old man with carcinoma of the colon.
(a) Conventional B-mode shows a heterogeneous liver echotexture but no definite focal lesions.
(b) Interrogation of the same area in pulse inversion mode following Levovist reveals multiple metastases , some as small as 3mm (arrow).
The above figure shows that tranverse imaging of the prostate during infusion of contrast agent demonstrates increased flow at the cancer site
(arrows).
- Blood flow and perfusion
Ventricular enhancement and delineation of endocardial borders can be seen allowing improved detection of wall motion abnormalities.
Also the administration of contrast medium has been shown to enable more accurate measurement of left ventricular volume, ejection fraction,
diagnosis and grading of valvular disease, thrombus detection, aortic dissection, detection of complications of myocardial infarction such as
ventricular rupture, and aneurysm formation.
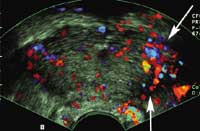
The figure above is an echocardiographic image of the left ventricle using real time imaging of perfusion and an intravenous microbubble
as contrast agent. The contrast agent fills the ventricular cavity, clearly delineating the endocardial border, and gives colour enhancement in
the myocardium, showing perfusion of the apex and septum (arrows)